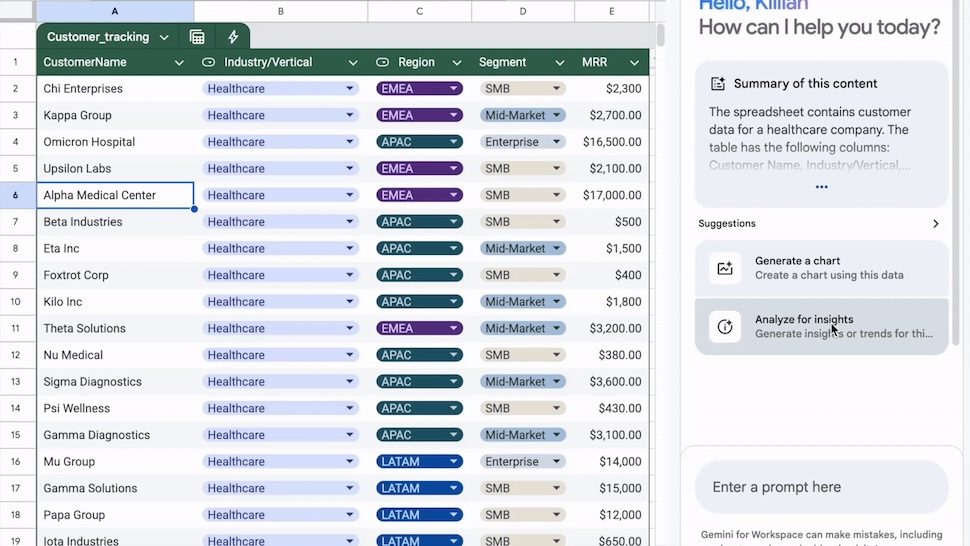
- Gemini can use Python to build data visualization graphics in Sheets
- You can also interact with it by asking questions about your data
- However charts won’t auto-update from live data sets
Google has rolled out a rather handy update to its Gemini which enables the AI tool to do more with the data you have in Google Sheets.
Using the Gemini add-on within the spreadsheet software, users can now build visualizations and analyze data in other ways, such as identifying trends, with the help of artificial intelligence.
In a Google Workspace update blog post, the company noted, “Gemini in Sheets can perform actions or answer questions to address a wide variety of scenarios.”
Google Sheets Gemini upgrade
The update means Gemini can now provide contextual trends, patterns, and correlations between different variables in your data, all of which can be turned into charts.
The company added: “This update reflects Gemini in Sheets’ enhanced intelligence as it now yields valuable outputs by transforming your requests into Python code, executing on them and then analyzing the results to perform multi-layered analysis.”
However, there is a catch – although no coding is required, the charts will be built using a one-time prompt and are therefore not linked to live data. Changes to the data will not be reflected in the charts, and users will need to generate new visualizations – albeit very easily with AI.
Google also noted the importance of a solid data foundation in order to give Gemini the best chance of success, adding, “For the most accurate results, ensure your data is in a consistent format, with clear headers and no missing values.”
It was also noted Gemini’s performance is most “consistent” in spreadsheets with fewer than one million cells, rendering the AI add-on slightly less appealing for large data sets.
Google Workspace Business Standard/Plus and Enterprise Standard/Plus customers will be among the first to get their hands on the updated AI tool, together with Google One AI Premium subscribers and anyone with the Gemini Education or Gemini Education Premium add-on.


Leave a comment